The State of the Dealer: 2026
What over 40,000 dealerships reveal about digital growth, demand, and the road ahead.
Download the Report

Top 10% of dealers generate 4.5x more leads
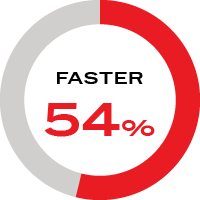
Top 10% turn inventory 54% faster on average

54% of shopper activity happens outside business hours
This isn’t survey data. It’s observed behavior.
The State of the Dealer: 2026 draws on signals across 40,000+ dealerships — website analytics, inventory interactions, inquiry paths, and follow-up activity — representing over 6.1 million units sold in a single year. Not what dealers say they do. What the data shows happens.
Where Demand Leaks Happen
Across the ecosystem, the data points to the same pattern: incomplete listings, broken inquiry paths, after-hours routing misses, and slow follow-up that quietly erodes demand dealers already earned. The report identifies where these failures concentrate — and what separates stores that close the loop from those that don’t.
What AI Is Doing to Discovery
Shoppers are already using AI tools to narrow choices before they ever reach a dealer’s site. The data shows that incomplete pricing fields, inconsistent inventory data, and broken inquiry paths don’t just hurt conversion — they reduce visibility at the discovery stage entirely.
How the Market Is Moving by Vertical
From powersports dealers operating with 14.43% fewer units year-over-year, to marine dealers facing a 20.81% per-dealer decrease in new unit inventory, to RV dealers returning to a balanced market — the report breaks down what the data shows for each vertical and what it means for the year ahead.
“The goal of The State of the Dealer: 2026 is not only to share trends and showcase data. It aims to define what ‘good’ looks like in 2026 — across the full buyer loop — so you can identify where demand leaks and fix it fast.”
From the Data — Four Stats Worth Knowing Before You Download:
- 83.30% of units among top-performing dealers include pricing
- 72.05% have at least one image — averaging 10.2 images per unit
- Only 20.92% of their inventory is 90 days or older
- 47.9% more high-quality leads are generated by dealers using digital retailing tactics such as unit-page pricing calculations
Also Inside: a Pass/Fail Checklist that You Can Run Today
The report closes with a four-part operational audit covering publishing stability, listing completeness, response discipline, and reporting alignment — built to run in a single meeting.